3D plot of complex sine wave
thingiverse
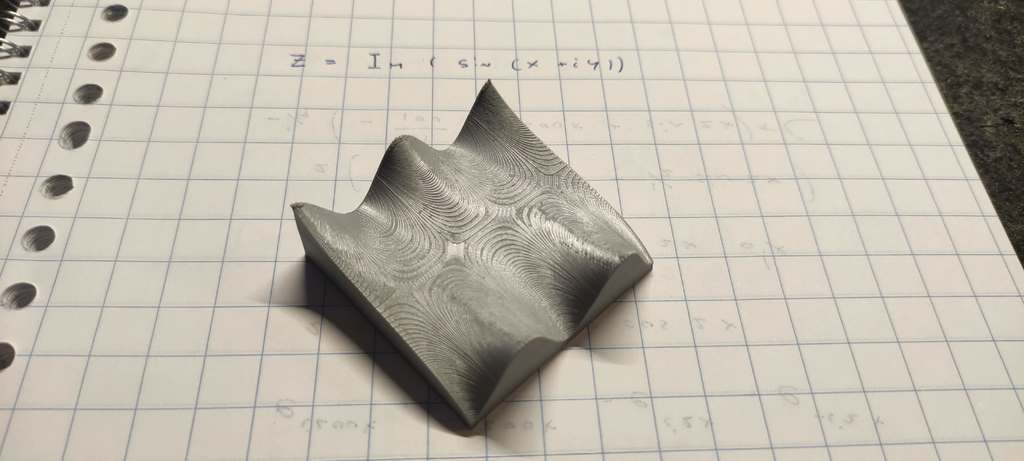
3 dimensional plot of the function Z = Im(sin(x + iy)), allows one to clearly see how the hyperbolic sine is related to the regular sine. Printing upright gives the smoothest surface, but is more likely to sag or warp during printing. To create a mathematically correct representation, the stl-file was generated by a python script using the numpy-stl module (https://pypi.org/project/numpy-stl/)
Download Model from thingiverse
With this file you will be able to print 3D plot of complex sine wave with your 3D printer. Click on the button and save the file on your computer to work, edit or customize your design. You can also find more 3D designs for printers on 3D plot of complex sine wave.