Acceleration Lab Re-mixed
thingiverse
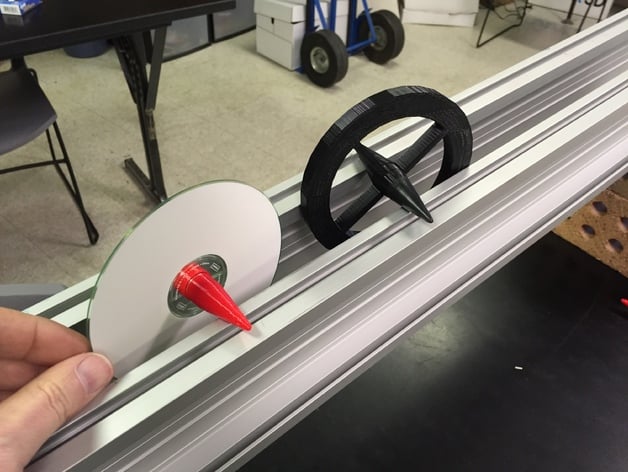
This is a remake of my Acceleration Lab Apparatus, but this time it's better. I was never fully satisfied with the original version, and then I saw this cool CD Spinning Top that made me think I could improve it by grabbing the screw together bits. I've created two versions of the apparatus, one requiring a CD for the disk and the other using the same printed disk I used previously. The CD version requires less than 5 grams of plastic to make, making it much more efficient than my first design. I was able to print a whole lab set in just two hours. Print Settings: Rafts: No Supports: No Resolution: 0.3 mm Infill: 10% Notes: Both versions simply screw together, requiring significantly less post-printing work than the original version. I have successfully printed in both PETG and PLA. For the rails, we used electrical conduit from Lowes or two Pasco tracks on their sides. The rails are held in place using bricks. It's essential to note that if the incline is too steep, the apparatus will slide rather than roll, resulting in inaccurate data. However, this can be fixed by coating the cones with Plastidip, which removes all sliding even for very steep inclines. Check out this blog post for a more detailed explanation of the lab. How I Designed This: I modified and combined the two original designs using Tinkercad. You can modify them yourself there: CD Acceleration New Acceleration Lab Standards: NGSS Scientific and Engineering Practices: Developing and using models Analyzing and interpreting data Using mathematical and computational thinking NGSS Crosscutting Concepts: Patterns - Analyzing data to determine rates of change, such as the constant rate of change in velocity and the varying rate of change in position. Scale, proportion, and quantity - A small acceleration can result in very large velocities given enough time. NGSS Core Idea PS2.A: Forces and Motion Lesson Plan and Activity: Show the Acceleration Apparatus to students and ask them to describe its motion and how it differs from the buggy cars used in the previous unit. Students collect data by marking the position of the disk every second as it rolls down the rails using a dry erase marker on the conduit. Students create a position vs. time graph and use regression functions in their calculators to find an equation that explains the data. If they were careful, a quadratic equation should fit nicely to the data. Transform the data to velocity vs. time and graph. Students can borrow the idea of a secant line from their math class to accomplish this. The graph should be linear. Find the equation of the line. Students whiteboard and share results with the class through Socratic dialog, helping them determine the variables and coefficients in both equations derived from the position and velocity data. Duration: Lab takes one class period Whiteboarding and discussion take 1-2 class periods Materials Needed: Supplies: For each lab group, you will need: 2 lengths of electrical conduit Bricks to hold the conduit 3D Printed Acceleration Lab Apparatus Dry erase markers Whiteboard Metronome or metronome app set to 60 beats/minute Students should have already developed the Constant Motion Model. References: Publications supporting Modeling Instruction: American Modeling Teachers Association
With this file you will be able to print Acceleration Lab Re-mixed with your 3D printer. Click on the button and save the file on your computer to work, edit or customize your design. You can also find more 3D designs for printers on Acceleration Lab Re-mixed.