Binghamton Election District Maps
thingiverse
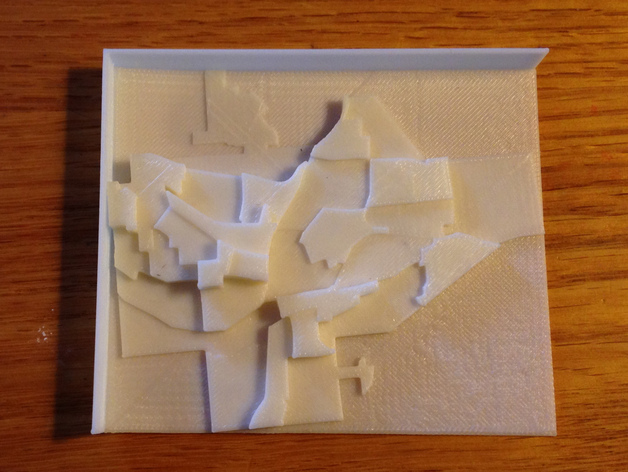
This pair of prism maps offers a comparison of population density and voter turnout by election district for the city of Binghamton, NY. The top and bottom of the reference walls represent the upper and lower bounds of the data as specified in the .scad scripts. The population density scale ranges from 0 to 5000 people per square kilometer; the voter turnout ratio scale ranges from 0 to 1 (100%). For a customizable prism map with broader appeal, see my Contiguous United States population density model. Data Provenance Binghamton election district boundaries derived from Broome County election district boundaries retrieved from the Broome County GIS Portal. Boundary shapefile attributes include 2010 census total population counts. Approximate election district areas calculated with QGIS using $area / 10764000 to convert square feet to square kilometers. Vote counts derived from "Whole Number" of votes in the 2013 Binghamton mayoral election, as tabulated by district on pages 88 and 89 of the election results provided by Broome County. Population density (ppsqkm) calculated as 2010 total population divided by area, yielding population per square kilometer. Voter turnout ratio (vt_pop) calculated as 2013 vote count divided by 2010 total population. Does not account for change in population between 2010 and 2013. Does not account for difference between total population and population of eligible voters. Methodology The ppsqkm and vt_pop values described above were created as attributes of a Binghamton election district shapefile named bgm-ed. Scripts to generate extruded 3D models of these maps were created with prismap and compiled to STL with OpenSCAD. To reduce file size, OpenSCAD's ASCII output was converted to binary format using Meshlab. Customizable The OpenSCAD scripts generated by prismap are compatible with Thingiverse Customizer. Click Open in Customizer to plug in your own data for Binghamton's election districts (be sure to adjust the upper and lower bounds of the data range accordingly), or use prismap to create extruded prism maps of your own study area. Instructions Printed with 10% infill, 1 shell, 0.2 mm layer height.
With this file you will be able to print Binghamton Election District Maps with your 3D printer. Click on the button and save the file on your computer to work, edit or customize your design. You can also find more 3D designs for printers on Binghamton Election District Maps.