Contour Map
thingiverse
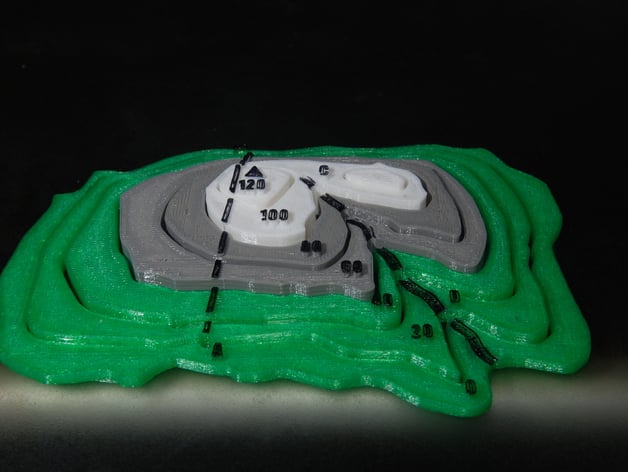
This is a custom contour map designed for a middle school earth science class. Each layer of the map has been carefully crafted by students to learn about contour maps and how they are used to represent changes in altitude. The layers are separate and distinct from one another, providing a tactile understanding of the concepts being taught. The map was created through a series of steps, beginning with tracing the contours of the original map using 3D printing software. I smoothed out the lines using GIMP and then imported the image into Inkscape, where I separated each layer and assigned arbitrary height numbers to them. The maps were then printed in three colors: green for lowlands, grey for mid-altitudes, and white for peaks. The design process involved several tools, including GIMP, Inkscape, and 123D Design. The map was trimmed to remove excess lines and loops, and each layer was carefully crafted to create a cohesive and educational product. For the custom section of the project, students will be working with blank paper, pencils, and the 3D printed contour maps. They will begin by tracing the tallest contour (120) onto the paper, and then continue adding layers until they have completed a complete contour map. The objective is to teach students how contour lines are used on maps to denote changes in altitude. The project is designed for middle school Earth Science students doing a mapping and geology unit, and is expected to take one to two class periods to complete. Students will work in pairs, tracing the contours of each layer, and marking the different heights and stream features onto the map. The teacher will then guide discussions on topics such as stream formation, erosion, and map reading. To facilitate this project, students will receive handouts with background information on contour maps and map reading, and can refer to textbooks or online resources for further learning. The assessments for this project will focus on demonstrating an understanding of maps, contour lines, stream formation, and erosion. In preparation for the project, teachers should provide students with blank paper, pencils, and the 3D printed contour map. It is expected that pairs of students will complete the project in a collaborative and respectful manner.
With this file you will be able to print Contour Map with your 3D printer. Click on the button and save the file on your computer to work, edit or customize your design. You can also find more 3D designs for printers on Contour Map.