Customizable US Map/Graph
myminifactory
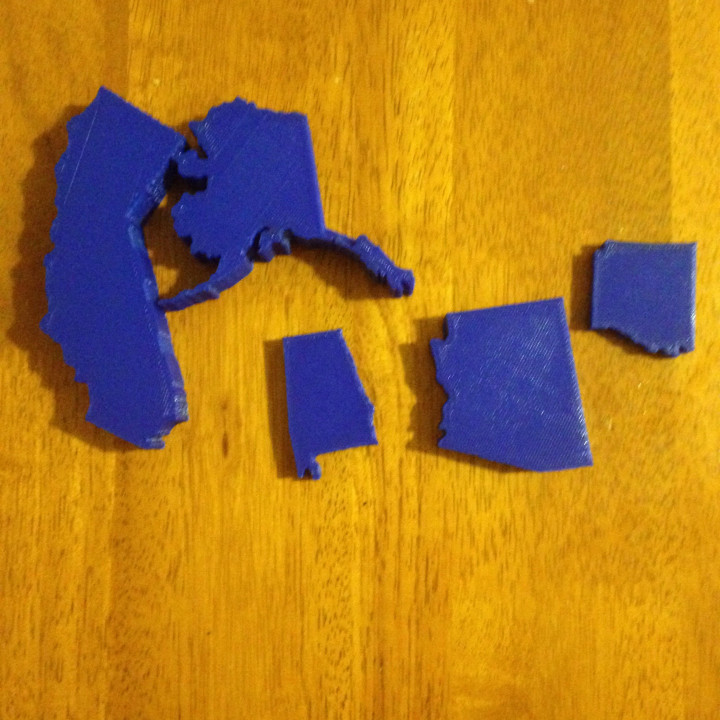
This is a 3D visual aid designed to help visualize data related to the US States. Each state can be assigned its own data point, and the scad script will automatically generate all states for you. Each state is printed individually so students can directly compare two states (even if they are on opposite sides of the map), and to allow for color coding using different filaments. The states can also be glued together to create a full map of the US. Using this tool, you could create: A map of median household income A colored map of states that fought in the civil war and the casualties from each state A map showing the founding year of each state and much more To use this tool: Download the two scad files: main.scad and states.scad You can either use a customizer or manually edit main.scad to enter in your data and the overall dimensions of your map Generate each state you want to print by setting the "state_to_print" field in main.py Included: Two scad files to generate your own maps A set of example STL files that compare median household income across states in 2017 Total cost for example is about $4.00 Requirements: You must have Open SCAD installed to create your own maps
With this file you will be able to print Customizable US Map/Graph with your 3D printer. Click on the button and save the file on your computer to work, edit or customize your design. You can also find more 3D designs for printers on Customizable US Map/Graph.