Designing a Mathematical Rollercoaster
thingiverse
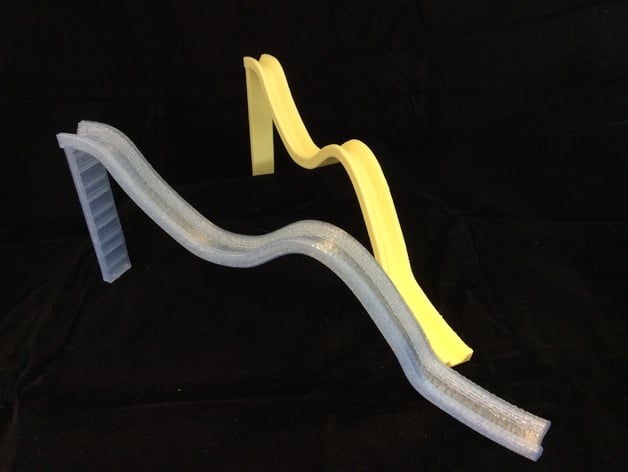
This is a detailed lesson plan for teaching students about functions and graphing while having them design and build a rollercoaster model using 3D printing technology. Here's a breakdown of the key points: **Lesson Overview** * Students will learn about various types of functions (linear, polynomial, trigonometric, logarithmic, and exponential) and how to graph them. * They will use technology to plot their graphs and design a rollercoaster model. * The final product is a 3D printed rollercoaster model. **Day 1-5: Design and Build** * Students work in groups to design a rollercoaster using graphing software (Desmos). * They take a picture of their design and convert it to an SVG file using online converter. * Import the SVG file into 123d Design, where they draw a spline that resembles the original curve. * Delete the original curve, scale the spline to the maximum printer size, and add support for printing. * The final step is to export the model as an STL file and bring it to the MakerBot desktop software. **Day 6: Wrap-up** * Each group presents their rollercoaster model and shares their answers to worksheet questions. * Students roll a marble or ball down their rollercoaster to test its design. **Assessment** * A rubric is provided for grading, which includes: + Following the rules for constructing the graph (10 points) + Correctly labeling equations and domains (50 points) + Answering worksheet questions correctly (20 points) + Participating in group work and class discussions (20 points) **Preparation** * Students should have a basic understanding of various types of functions, how to graph them, and perform transformations on them. Overall, this lesson plan is designed to be engaging and hands-on, allowing students to apply their knowledge of functions in a real-world context. The use of 3D printing technology adds an exciting element to the project, making it more interactive and fun for students.
With this file you will be able to print Designing a Mathematical Rollercoaster with your 3D printer. Click on the button and save the file on your computer to work, edit or customize your design. You can also find more 3D designs for printers on Designing a Mathematical Rollercoaster.