HISTOGRAM DISTRIBUTION MATHEMATICS MANIPULATIVE
thingiverse
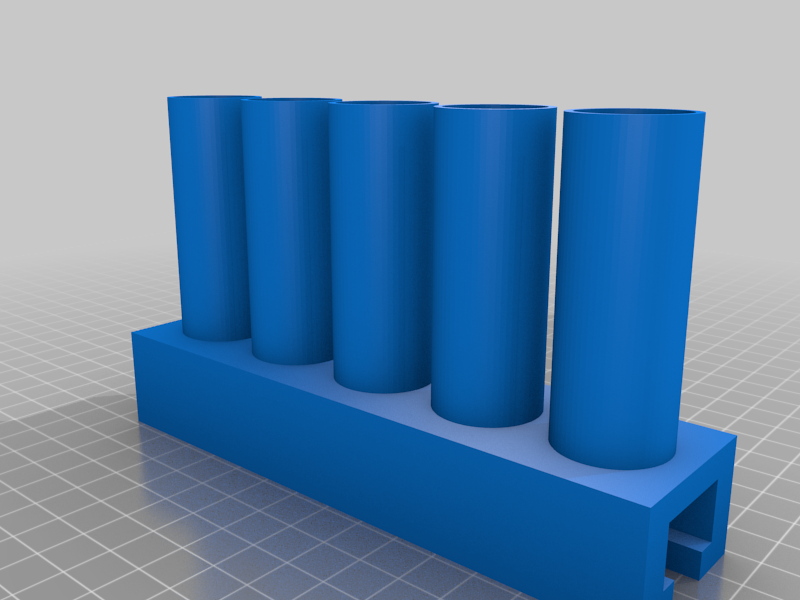
This mathematics manipulative that would be used in an Introduction to Statistics course. The device would be used to represent data as a histogram using 5 hollow cylinders which pennies (that would represent a data point) would be stacked into. The pennies would represent a data point in a given category, this will result in a histogram distribution. Depending on the data, the stacks of pennies in the cylinder will present themselves in many different ways. The second part of the concept is the cylinders being placed on a moveable balance beam. The beam will be made up of two pieces. One part is a stand with a large circular base and 1cmx1cm rectangular prism with T-shape at the top that will fit into the track of the second piece that will be a prism with enough length so 5 cylinders lined up on top. The bottom of the top/second piece will have a T-shape track in which the top of the stand’s T-shape piece will fit and be able to move within any point of the rectangular prism’s length. This will allow an individual to be able to move the point in which the top piece with the cylinders will balance on the stand. The point of balance in a given distribution represents the mean, which is the concept that this math manipulative visualizes.
With this file you will be able to print HISTOGRAM DISTRIBUTION MATHEMATICS MANIPULATIVE with your 3D printer. Click on the button and save the file on your computer to work, edit or customize your design. You can also find more 3D designs for printers on HISTOGRAM DISTRIBUTION MATHEMATICS MANIPULATIVE.