Mathematical Modeling: Desmos
thingiverse
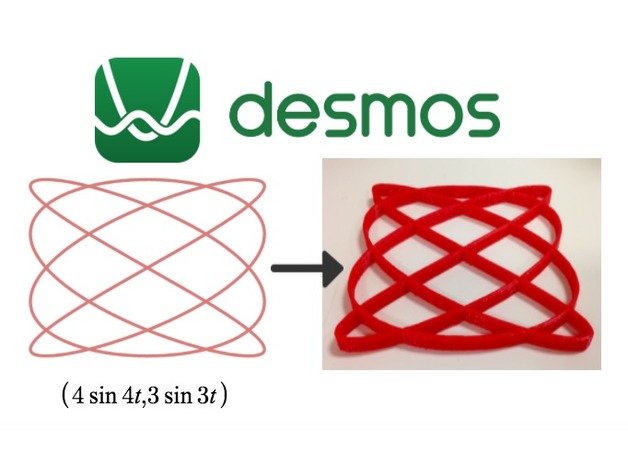
The following tutorial enables students to 3D print mathematical graphs using the free online graphing calculator Desmos. Desmos can be found at https://www.desmos.com/calculator, and it's a fantastic learning tool because it's completely free to use and works seamlessly on any device your students have access to. Moreover, there are even an iPad app and a Chrome extension available for those students with Chrome Books. Note: Desmos excels in graphing and printing 2-dimensional graphs, but for three-dimensional mathematical representations, take a look at Henry Segerman's paper titled "3D Printing for Mathematical Visualization," which can be found at http://www.ms.unimelb.edu.au/~segerman/papers/3d_printed_visualisation.pdf. **Standards** NGSS: CCSS: **Overview and Background** Using 3D printing to visualize mathematical computations allows students to manipulate, understand, and better grasp the concepts they're learning. Desmos not only enables students to 3D print their calculations but also provides design challenges for utilizing graphs for various purposes. For example, when teaching students how to graph circles with specific areas, you can have them 3D print their circles that must fit a certain number of predetermined objects within, such as jelly beans or Skittles. Desmos is suitable for the following classes: * Pre-Algebra * Algebra 1 and 2 * Trigonometry * Geometry * Pre-calculus * Calculus (AP) * Statistics **Lesson Plan and Activity** Step 1: Create a design in Desmos: For Desmos tutorials, visit http://learn.desmos.com/. Step 2: Set up the image for taking a screen shot: * Remove the background grid by choosing the wrench in the upper right corner and un-clicking the round grid, x-axis, and y-axis. * If you don't remove these, they will be converted to part of the 3D design. Choose "Projector Mode," which makes graph lines thicker and easier for 3D printing. Step 3: Take a screen shot of just your graph using the commands for your computer. You can find how to do this on your computer by visiting https://www.take-a-screenshot.org/. **Converting Screen Shot to 3D File** To be able to 3D print the mathematical graphs, you'll need to change the screen shot images into an .SVG file (Scalable Vector Graphic). Step 3: Go to http://picsvg.com/, where you can upload your screen shot and convert it to an .SVG file while viewing the .SVG before downloading. Step 4: Once you have downloaded the .SVG file, import it into your CAD program of choice. The image below had the model imported into TinkerCAD, where a student could manipulate the model further if desired. Step 5: Within the CAD program, students can add a back to their model, make it thicker, taller, or whatever change is necessary for the lesson's outcomes. Step 6: Once the students' 3D model is finished, save the file for 3D printing in an .STL or .OBJ file format.
With this file you will be able to print Mathematical Modeling: Desmos with your 3D printer. Click on the button and save the file on your computer to work, edit or customize your design. You can also find more 3D designs for printers on Mathematical Modeling: Desmos.