Netherlands Topographic 3D Map #MakerEdChallenge 2.0
thingiverse
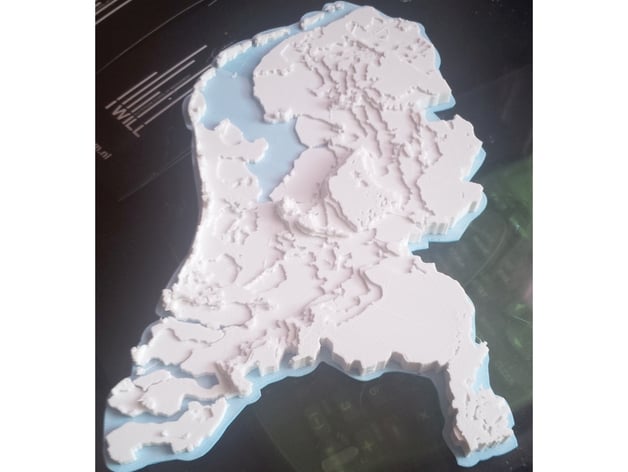
An elevation map of The Netherlands! Get a new perspective on this beautiful country. Also check out the flooded version: http://www.thingiverse.com/thing:699728 It has been simplified into 7 height levels using SolidWorks and Illustrator: Level 1 is 12m below sea level Level 3-4 is approximately at sea level Level 7 is 14m to 300m above sea level I did not print the height in the right scale; the country is so flat, that on scale, the total height difference would only be 0.2mm. I would recommend to scale x/y and z independently when fitting this to your printer bed. For more interesting calculations, check the comment section. If you make one, please share your result! Print Settings Rafts: No Supports: No Resolution: 0.4mm nozzle, 0,1mm layer height Infill: 30% Notes: Pay attention to the retraction and travel settings of your printer (if your slicer allows you to modify it). Because of the quirky paths it has to make, the printer might make a hairy print and you'll spend 20 minutes removing those. How I Designed This As a source, I used a Rijkswaterstaat topographic map. This is a map without any writing or drawing on it; it just shows the height of the area relative to sea level by using different colours. There might be programs that will automatically turn this into a gradual 3d-model, but I wanted to do it in a specific way. In Adobe Illustrator, I removed any noise from the picture and reduced the amount of colours to 7, which means it now has 7 different height levels. Then, I could isolate each colour, and put them in different layers. Each layer could be imported into a CAD program (in my case, SolidWorks), and be extruded to a height that made sense for my model. Instructions I tried switching filament after the first layers to get a different colour 'neutral layer', but misunderstood the setting, so it did another white layer after the filament switch... The result however is better than I imagined. The unscaled Z-height of the 'neutral layer' is 1mm. For my Ultimaker Original, I scaled the X and Y to 0.25. The Z was scaled to 0.5. With 40% infill, the model took 7.15m of filament (53 grams). Project: Topography Overview & background We don't see a lot of the world around us. There are mountains, lakes, oceans, but as a normal person you will never have the chance to view them from above and analyse it. Studying topography can learn you about an area's origin, its existence, the local struggles and advantages of nature, and an explanation of its wonders. This project is based on a model of The Netherlands and shows its struggles with the North Sea, but the idea can be extrapolated to other geographic areas - all you need is a topographic map. You might find one at https://www.arcgis.com/home/webmap/viewer.html, http://www2.jpl.nasa.gov/srtm/cbanddataproducts.html, or at a local website. Objectives By studying the model, students can get a better understanding of The Netherlands, but also on a greater scale, the world. Depending on age and level, they can do different analyses and calculations; for everyone, there are valuable lessons to learn. Audiences You can use this model in just about every age and skill level; from primary school to university, you'll find interesting subjects to talk about and different degrees of skill and depth. Subjects Geography, and to a lesser degree, Mathematics and History Lesson/Activity Since there are many options, I'll just bulletlist a few in short descriptions, chronographically from primary school upwards. Some of the questions here I've already answered in the explanation and the comments, but don't let that stop you from figuring them out again with your students. Explore the country: where do you live? How big is the country? Why is it shaped like this? Where have you been in your life? What would happen if the dikes break, and the seas or the rivers flow inland? (see also my remixed model) Simulate this by pouring water into the model, and see what happens. Push a pin into the model at different interesting locations: what happens to your own city? What happens to Amsterdam? What happens to the Wadden islands and Zeeland? Where would we go when this happens? Discuss the simplifications in the model. Why is the Afsluitdijk not visible? Why is the highest point not jumping out? How realistic is this model, what can we learn from it, and what should we NOT learn from it? Why is it flat while the real country is part of a sphere? Scale up: do calculations from this model. How would this look like on a sphere (earth)? How big would the sphere be? How mucht height difference would there be in the middle if it was on a sphere? How much is that in the real world - i.e. how curvy is the country? Get a better understanding of the scale of the earth. You might even introduce a ball the size of the moon in the same scale. Use this model as inspiration, and let the students make their own model of The Netherlands. This one uses height, but there are many more ways to categorize a country. Draw, lasercut, paint, build, cut, sculpt your own version of the country; map forests, population, crime, rivers, traffic, or whatever you want. Imagine how the country would look like if it was in the tropics or the pole regions. Create your own model of another country or region. Instructions can be found above. The current model is actually being used in topography classes, as I've made several for a geography teacher that uses it regularly with her high school students. Preparation Greatly depending on the group you're introducing this model to. I'd like to think you can just plunge into discussion and assignments, but if you are not familiar with the country itself and its origins (the Dutch constant battle with the sea for instance), that might need some studying first. It's a very interesting topic anyhow, that any geography teacher would be enthusiastic to tell about. Results This depends too much on what you do with the model. You can use it for one lesson, but you might also build an assignment around it. Anyhow, I'd like to hear what you did, what the results were, and how you liked it! Show it in a Make.
With this file you will be able to print Netherlands Topographic 3D Map #MakerEdChallenge 2.0 with your 3D printer. Click on the button and save the file on your computer to work, edit or customize your design. You can also find more 3D designs for printers on Netherlands Topographic 3D Map #MakerEdChallenge 2.0.