Spectra Scope
thingiverse
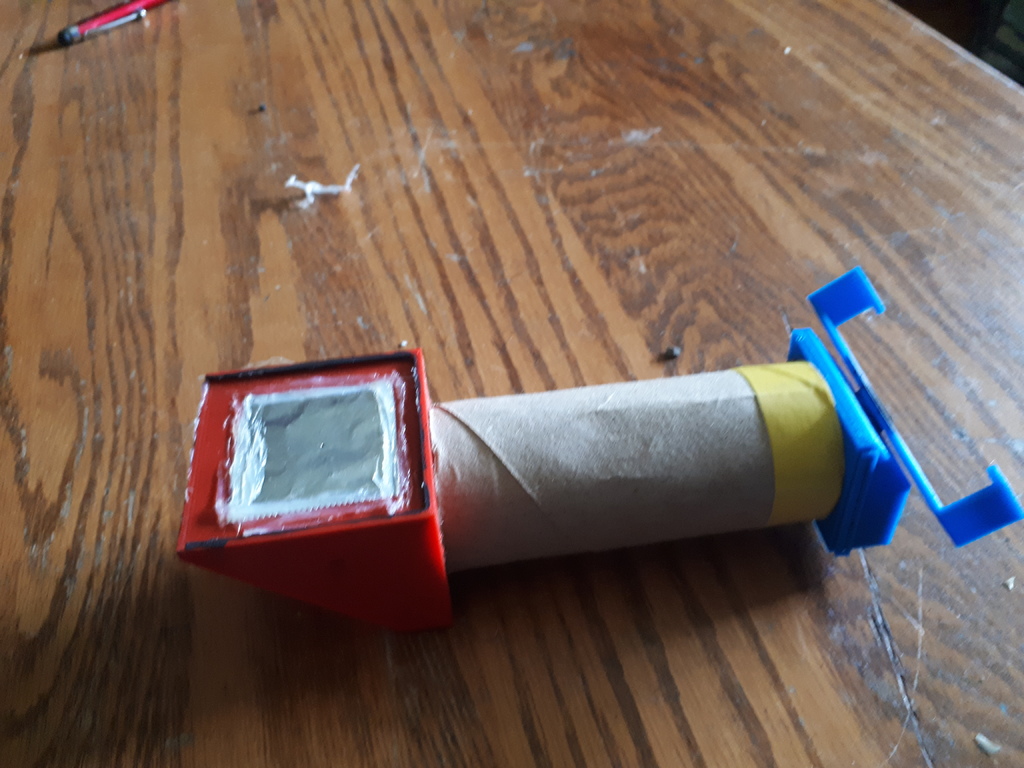
This is a printable light spectrum analyser that's meant to work in conjunction with a smart phone, to take spectral photos of a given light source, and analyse the result. I've also included links to 2 python scripts, one is used for batch processing files, the other is the guts of the analysis. Additional materials required are a toilet paper roll, a small mirror, mine was a 2" square one from amazon, and a diffraction grating, again purchased from amazon. The diffraction grating I used is 1000 lines/mm, deviating from that will shift the diffraction angle relative to wavelength, either up or down depending on your grating. The hole of the aperature cover should be covered with a piece of tinfoil, and its backside, including foil, painted with matte black paint. Affix the foil in place by skirting the edge with hot glue, pushing down as you go to eliminate any gap. Then pierce the foil, near the centre of the hole, with as small a needle as you can find. The smaller the hole the more accurate the scope will be. Be sure to paint the inside of the aperature and diffraction bodies with matte black paint to mitigate reflections. Also, if your taking photos of LED's and other high intensity point sources, a refractory material is recommended to eliminate the pinhole camera effect, and reduce overall intensity. I use white semitransparent tissue paper, or a piece of thin white foam held over the pinhole. With everything assembled, use a combination of matte black paint and hot glue to seal up any light leaks. The analysis takes a vertically oriented spectrum photo, which is a cropped version of the full sized one taken with a smartphone, and sums pixel intensity (calculated using a sum of squares average across RGB values) on a per row basis. It then produces a scaled plot of the intensity, overlayed on a rotated version of the spectrum photo. This plot can either be viewed directly, or output to a png file (which its set to do by default). This analysis seems to be a reasonable estimation of the actual spectral output, but everything should considered in the light of calibration sources. I have also included many analysed outputs as proof of my claims of reasonable estimation. If anyone has any questions, would like more info, has feedback, etc, feel free to contact me via email at matthew.czyzewski@gmail.com. Apologies in advance for the state of my code, Im a messy coder that sucks at commenting. https://drive.google.com/file/d/1Wg28ZWLNL7B1j5UWMwX1IbPlsJFKrySK/view?usp=sharing https://drive.google.com/file/d/1bMGi7A26TfLxaeVlh2hP7gV1-pX6N3PT/view?usp=sharing Required Python Packages mat-plot-lib os PIL (A.K.A Pillow) math
With this file you will be able to print Spectra Scope with your 3D printer. Click on the button and save the file on your computer to work, edit or customize your design. You can also find more 3D designs for printers on Spectra Scope.