Tomato Gene Expression
thingiverse
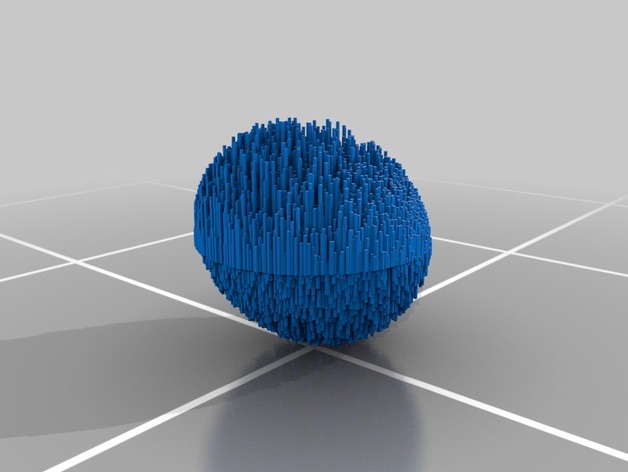
This is a 3D sculpture of a Principal Component Analysis performed on the expression profiles of >20,000 genes from Solanum lycopersicum (domesticated tomato) and a desert relative, Solanum pennellii. Gene expression was sampled in the inflorescence, mature leaf, root, seedling, stem, and vegetative apex. This sculpture is derived from the PCs 1-3 (x, y, z), with each "rod" representing data from a single gene. Data used in this sculpture is derived from the linked publication (http://www.ncbi.nlm.nih.gov/pubmed/23585653). Data pertaining to the PCA is below: Percent variance explained by each PC: PC1: 34.4% variance PC2: 23.9% variance PC3: 20.1% variance PC1 loadings Inflorescence: 0.004 Leaf: 0.239 Root: -0.477 Seedling: 0.379 Stem: -0.461 Vegetative Apex: 0.600 PC2 loadings: Inflorescence: -0.740 Leaf: 0.646 Root: 0.047 Seedling: 0.015 Stem: 0.096 Vegetative Apex: -0.151 PC3 loadings: Inflorescence: 0.300 Leaf: 0.354 Root: -0.559 Seedling: -0.556 Stem: 0.398 Vegetative Apex: 0.069
With this file you will be able to print Tomato Gene Expression with your 3D printer. Click on the button and save the file on your computer to work, edit or customize your design. You can also find more 3D designs for printers on Tomato Gene Expression.