United States by Carbon Emissions per capita (2000-2014)
thingiverse
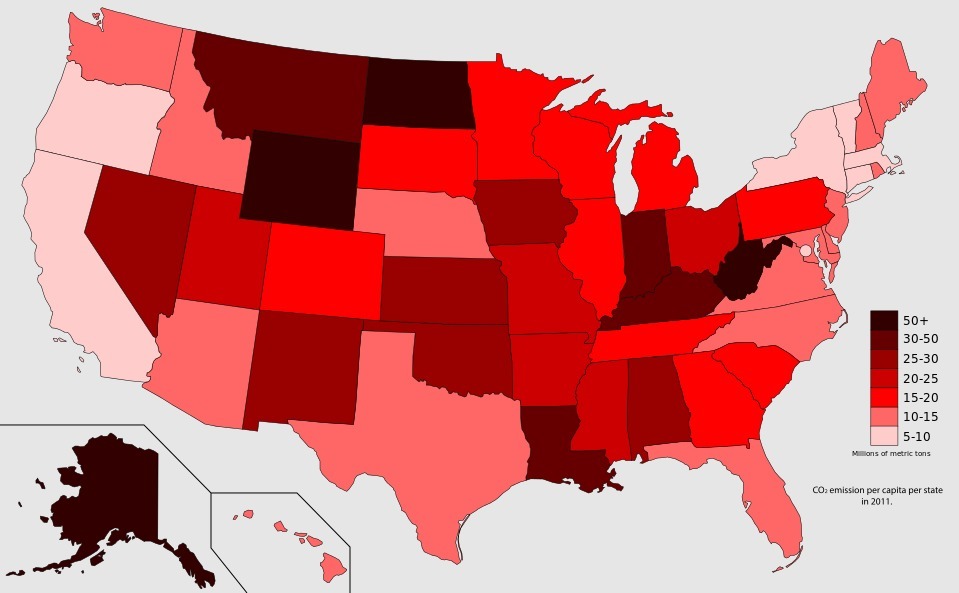
3D map of the United States showing carbon emissions per capita based on data ranging between 2000-2014. Data gathered from: https://www.eia.gov/environment/emissions/state/analysis/ Customized version of http://www.thingiverse.com/thing:209005 Created with Customizer! http://www.thingiverse.com/apps/customizer/run?thing_id=209005 Part of United Stats of America collection https://www.thingiverse.com/danowall/collections/united-stats-of-america
With this file you will be able to print United States by Carbon Emissions per capita (2000-2014) with your 3D printer. Click on the button and save the file on your computer to work, edit or customize your design. You can also find more 3D designs for printers on United States by Carbon Emissions per capita (2000-2014).